Hmmmm. Jos ensimmäisenä on rokotettu riskiryhmäläisiä, vanhuksia, heikossa kunnossa olevia, kuolleisuus on varmasti korkeampi. Mikä on tarkastelujakso? Vuosi? Kaksi vuotta? Jos rokotat kaksi riskiryhmäläistä, molemmat 90-vuotiaita, ja seurantajakso on 2 vuotta, niin todennäköisyys 50% kuolleisuudelle on melko suuri - tuon ikäinen menee huonolla munkilla multiin jo virtsatietulehduksesta, kokemusta on. ”Ryhmissä oli kaikenikäisiä”, mutta millä painotuksella?
Video herättää enemmän kriittisiä kysymyksiä tuosta veijarin tutkimuksesta kuin itse rokotteesta. Tuollaiset parin sadan ihmisen otannat on tilastotieteilyssä vähintäänkin huvittavia. Tilastollisesti 100% ihmisistä kuolee.
Enkä nyt sano etteikö tuossa rokotekuviossa olisi ollut rahankäärintää ja hyvävelimeininkiä, mutta Twitter-video jossa on powerpoint-mies kauluspaidassa ja rillit nenällä näyttää omiin silmiin lähinnä hellyttävältä päiväkoti-ikäisen puuhailulta.
Pitäis varmaan perehtyä syvemmin ennen kuin tuohon kannattaa enempää sanoa. Mielenkiintoinen joka tapauksessa.
Tuossa on professoritason rauhallisempaa analyysiä tuosta datasta, josta tuo valkeapaitainen hellyyttävä mies siis kaivoi esiin ne kaikkein raflaavimmat batch:it:
https://wherearethenumbers.substack.com/p/the-new-zealand-vaccine-data-what
The New Zealand vaccine data: what I actually saw and analysed and what the limitations are
 NORMAN FENTON
2.12.2023

The slide in Steve Kirsch’s MIT speech that quoted me
Note:
As new information becomes available I have been updating this article, so some of the conclusions are different to the original version.
The data and its provenance
Anybody who has followed our writings over the last 3 years will know that we believe there is overwhelming evidence that the covid vaccines are neither effective nor safe. Contrary to ludicrous claims made by official Government sources there is no evidence the vaccines have saved any lives (let alone the millions claimed), but rather evidence that all-cause mortality in the vaccinated is now higher than that in the unvaccinated.
In the last few days there have been claims that leaked vaccination record data from New Zealand provides the most comprehensive evidence yet of how unsafe the vaccines are. A description and analysis of the data is provided in this
article and MIT presentation by Steve Kirsch. Because Steve quoted me it appears that I have unwittingly become a key figure in the debate over the data.
I, along with numerous colleagues, was asked to look at an anonymised version of the dataset. I was told this was accurate, reliable record-level data on a very large, random subset of the vaccinated population (it contains over 2 million vaccination records) for the first 2 years of the covid vaccination programme. Any conclusions (including those below) about vaccine safety based on the dataset are only valid if these assumptions about the data are true. Since looking at the data there have been claims that the dataset may not be random since it contains a disproportionate number vacinees who died during the 2-year period. This would mean the data is biased, in which case most of the conclusions made about it would not be generalisable. Igor Chudov has also expressed
concerns about the provenance of the data. However, having spoken with Steve Kirsch today, he says that there are widespread misunderstandings about the data and it is not biased. For a start he says that the datatset is the complete set of ‘pay-per-dose’ vaccination records and therefore there is no biased sampling at all. He says:
The people within the group is representative of the total population. There are 2.2 million people in the group, and there are 4 million records. Each of those records is a Vaccination Record.
There were 1.348 billion person days in the "vaccinated state" in the sample. There were 37,283 deaths. This is an average mortality rate of 1009 for the vaccinated people. An average population is 800 deaths per 100K person years. But this population is more elderly skewed let's call it 900 deaths per 100K/p-y. Well, vaccinated people will die, on average, about 10% higher than normal. So that's 990 deaths per 100K p-y. Well our numbers are 1,009 deaths per person year which is 1.9% higher. That is hardly biased.
What is in the dataset
Each record in the dataset corresponded to a vaccination and included information about: age of vaccinee, batch number, vaccination centre, date and dose number, and number of days to death if that person died during the 2-year period. However, there were always fundamental limitations of the dataset if we were to draw any firm conclusions about vaccine safety from it. The most obvious was the absence of any records of unvaccinated people during the period. This meant that, for example, comparisons of all-cause mortality between vaccinated and unvaccinated could only be made based on external, more general (and often disparate) population mortality and excess death data. For those who died there was also no information about whether cause of death was recorded as covid.
It is a very large dataset - far too big to be opened in Excel - and so required specialist database tools and skills to analyse it thoroughly. Because of my rather extreme personal circumstances (and because the kind of database skills required in this case are outside my area of expertise) I relied on others to provide some summary information that I could only analyse briefly.
The safety signals in the data
I had been told that the most significant safety issues for the vaccine in the dataset was revealed by a) time series analysis of the various doses by age group and b) clusters of deaths associated with certain batches.
I looked at Steve Kirsch’s various time series analyses and felt that, even accounting for inevitable ‘survivor bias’ (the more jabs a person gets, the quicker they are likely to die after their last jab) there was some evidence of increased risk the more doses a person gets. Moreover, given Steve’s comments about the datatset being the complete set of ‘pay-per-dose’ vaccination records, this conclusion seems robust even if there were a biased proportion of vaccinee deaths in the dataset. Also (as per my above quote in Steve’s presentation) I felt that the data provided further support for the hypothesis that the vaccine was increasing the mortality rate in the older population (something which we had
already concluded based on the most recent ONS data). This latter observation also seems to be robust even after taking account of the confounding effect of disproportionate number of vaccinee deaths.
What I am now much more concerned about are the conclusions I originally stated about the clusters of deaths associated with a small number of Pfizer batches. Because I was told this was especially revealing I asked for the following very simple summary information for each batch at each vaccination site:
- the total number of people vaccinated
- the total number of deaths
- average days from last vaccination to death
- the average age of the vaccinated
I said I would do a basic probabilistic analysis of the clusters with that summary information.
My small analysis of the strange batch data
What I received was a file with only the total number of people vaccinated and the total number of deaths for 118 batches (so I did not have the critical information about average days from last vaccination to death and average age of the vaccinated, but was assured there were no major differences between the batches):
Batch Ratio
43.5KB ∙ PDF file
Download
The total number of vaccinees associated with these 118 batches was 2,213,062. The largest number in any batch was 101,896 and the smallest was 38. The total number of deaths is 37,073 so the average death rate is 1.68%
There were 1228 deaths in the largest batch, so the death rate for the largest batch is 1.21%.
However, five batches have a death rate of over 10%:
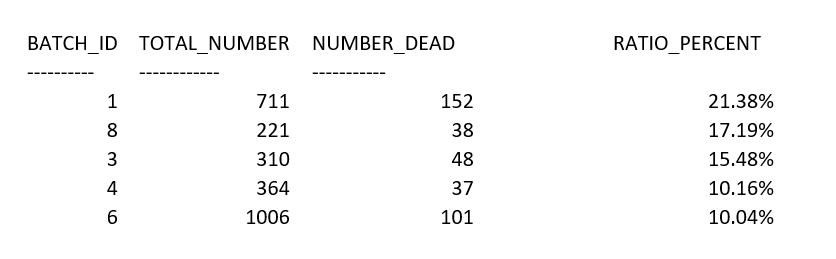
The question is: what can we conclude about vaccine safety given the fact that these batches had such a high death rate compared to the average?
It is important to note that there are possible causal explanations unrelated to vaccine safety that could lead to batches with such unusually high death rates. Specifically:
- Explanation A (very elderly cohort given early) : Most obviously, we would likely observe such results if these batches were given to cohorts of the very elderly/very ill early in the vaccination programme. In this case it is inevitable that many more than average would die anyway within a two-year period after vaccination.
- Explanation B (incomplete/biased batch data): It is also possible that batches with such exceptionally unusual death rates would be observed if the data were incomplete and non random; for example, if the data does not include all those vaccinated from specific batches, with those dying disproportionally included in the data.
- Explanation C (seasonality): It is possible that batches were given during periods of especially high population death rates unrelated to vaccine reactions.
If, as had been suggested to me, that the average days from last vaccination to death and average age of the vaccinated was similar across all batches, then it would be reasonable to rule out explanations A and B. But, it now appears that this is not the case. I did an analysis before knowing this. I said that, if these explanations can be ruled out (so we are assuming all batches are similar in terms of distribution of age of vaccinees and time vaccines were given) then we can estimate the probability that, by chance alone, we would see such batches with exceptionally high death rates. Specifically, let
H be the hypothesis that “the vaccine and its delivery is similar across batches”, then:
- Under hypothesis H it is reasonable to assume that the ‘true’ average death rate is approximately 1.68% since this is the overall death rate for all those vaccinated.
- Under Binomial distribution assumptions, the probability that in 118 batches we would observe at least one batch whose size is at least 500, with a death rate above 20% is infinitesimally small (less than 1 in 10 billion). So, the batch 1 observation would be essentially impossible under hypothesis H.
- Even if we ignore batch 1, we have 4 other batches out of 118 (all of size >220) that have a death rate above 10%. The probability that, in a specific batch of size 221 the death rate would be above 10% is less than 1 in 6 million. The probability that at least 1 out of 118 batches would have a death rate above 10% is about 1 in 53,000. However, the probability that at least 4 out of 118 batches would have a death rate above 10% is less than 1 in 100 billion.
Therefore, if explanations A, B and C could be ruled out, the hypothesis of similarity of batches could be rejected with near certainty. In that case the conclusion would be that chance alone cannot be the cause of the exceptionally high death rates in these batches. In the absence of any other causal explanation, that would mean that in these batches the vaccines (or their delivery) were genuinely more deadly than expected.
Conclusions
If the dataset is a real, unbiased and representative subset of those vaccinated, then it is potentially one of the most important publicly available datasets for examining covid vaccine safety, despite the fundamental limitation imposed by absence of data on the unvaccinated. It provides evidence of lack of safety of the vaccine. However, some of the conclusions drawn from the data would be confounded if the claims that it contains a disproportionate number of vaccinee deaths is true. Steve Kirsch is adamant that there is no such bias because it a complete record of all ‘pay-per-dose’ vaccinations. If Steve is correct about this, then his conclusions about the evidence of lack of safety are reasonable.
What we can probably discount is the claim concerning batches with exceptionally high mortality rates. The claim that these batches were especially deadly due to the contents of the vaccine or its delivery is confounded by their very different age and time of vaccination profiles.


 www.facebook.com

 puheenvuoro.uusisuomi.fi